S&P500 Daily Action Areas & Price Targets 1/7/26

S&P500 Daily Action Areas & Price Targets 1/7/26
***QUOTING ES1! FOR CASH US500 EQUIVALENT LEVELS, SUBTRACT POINT DIFFERENCE***
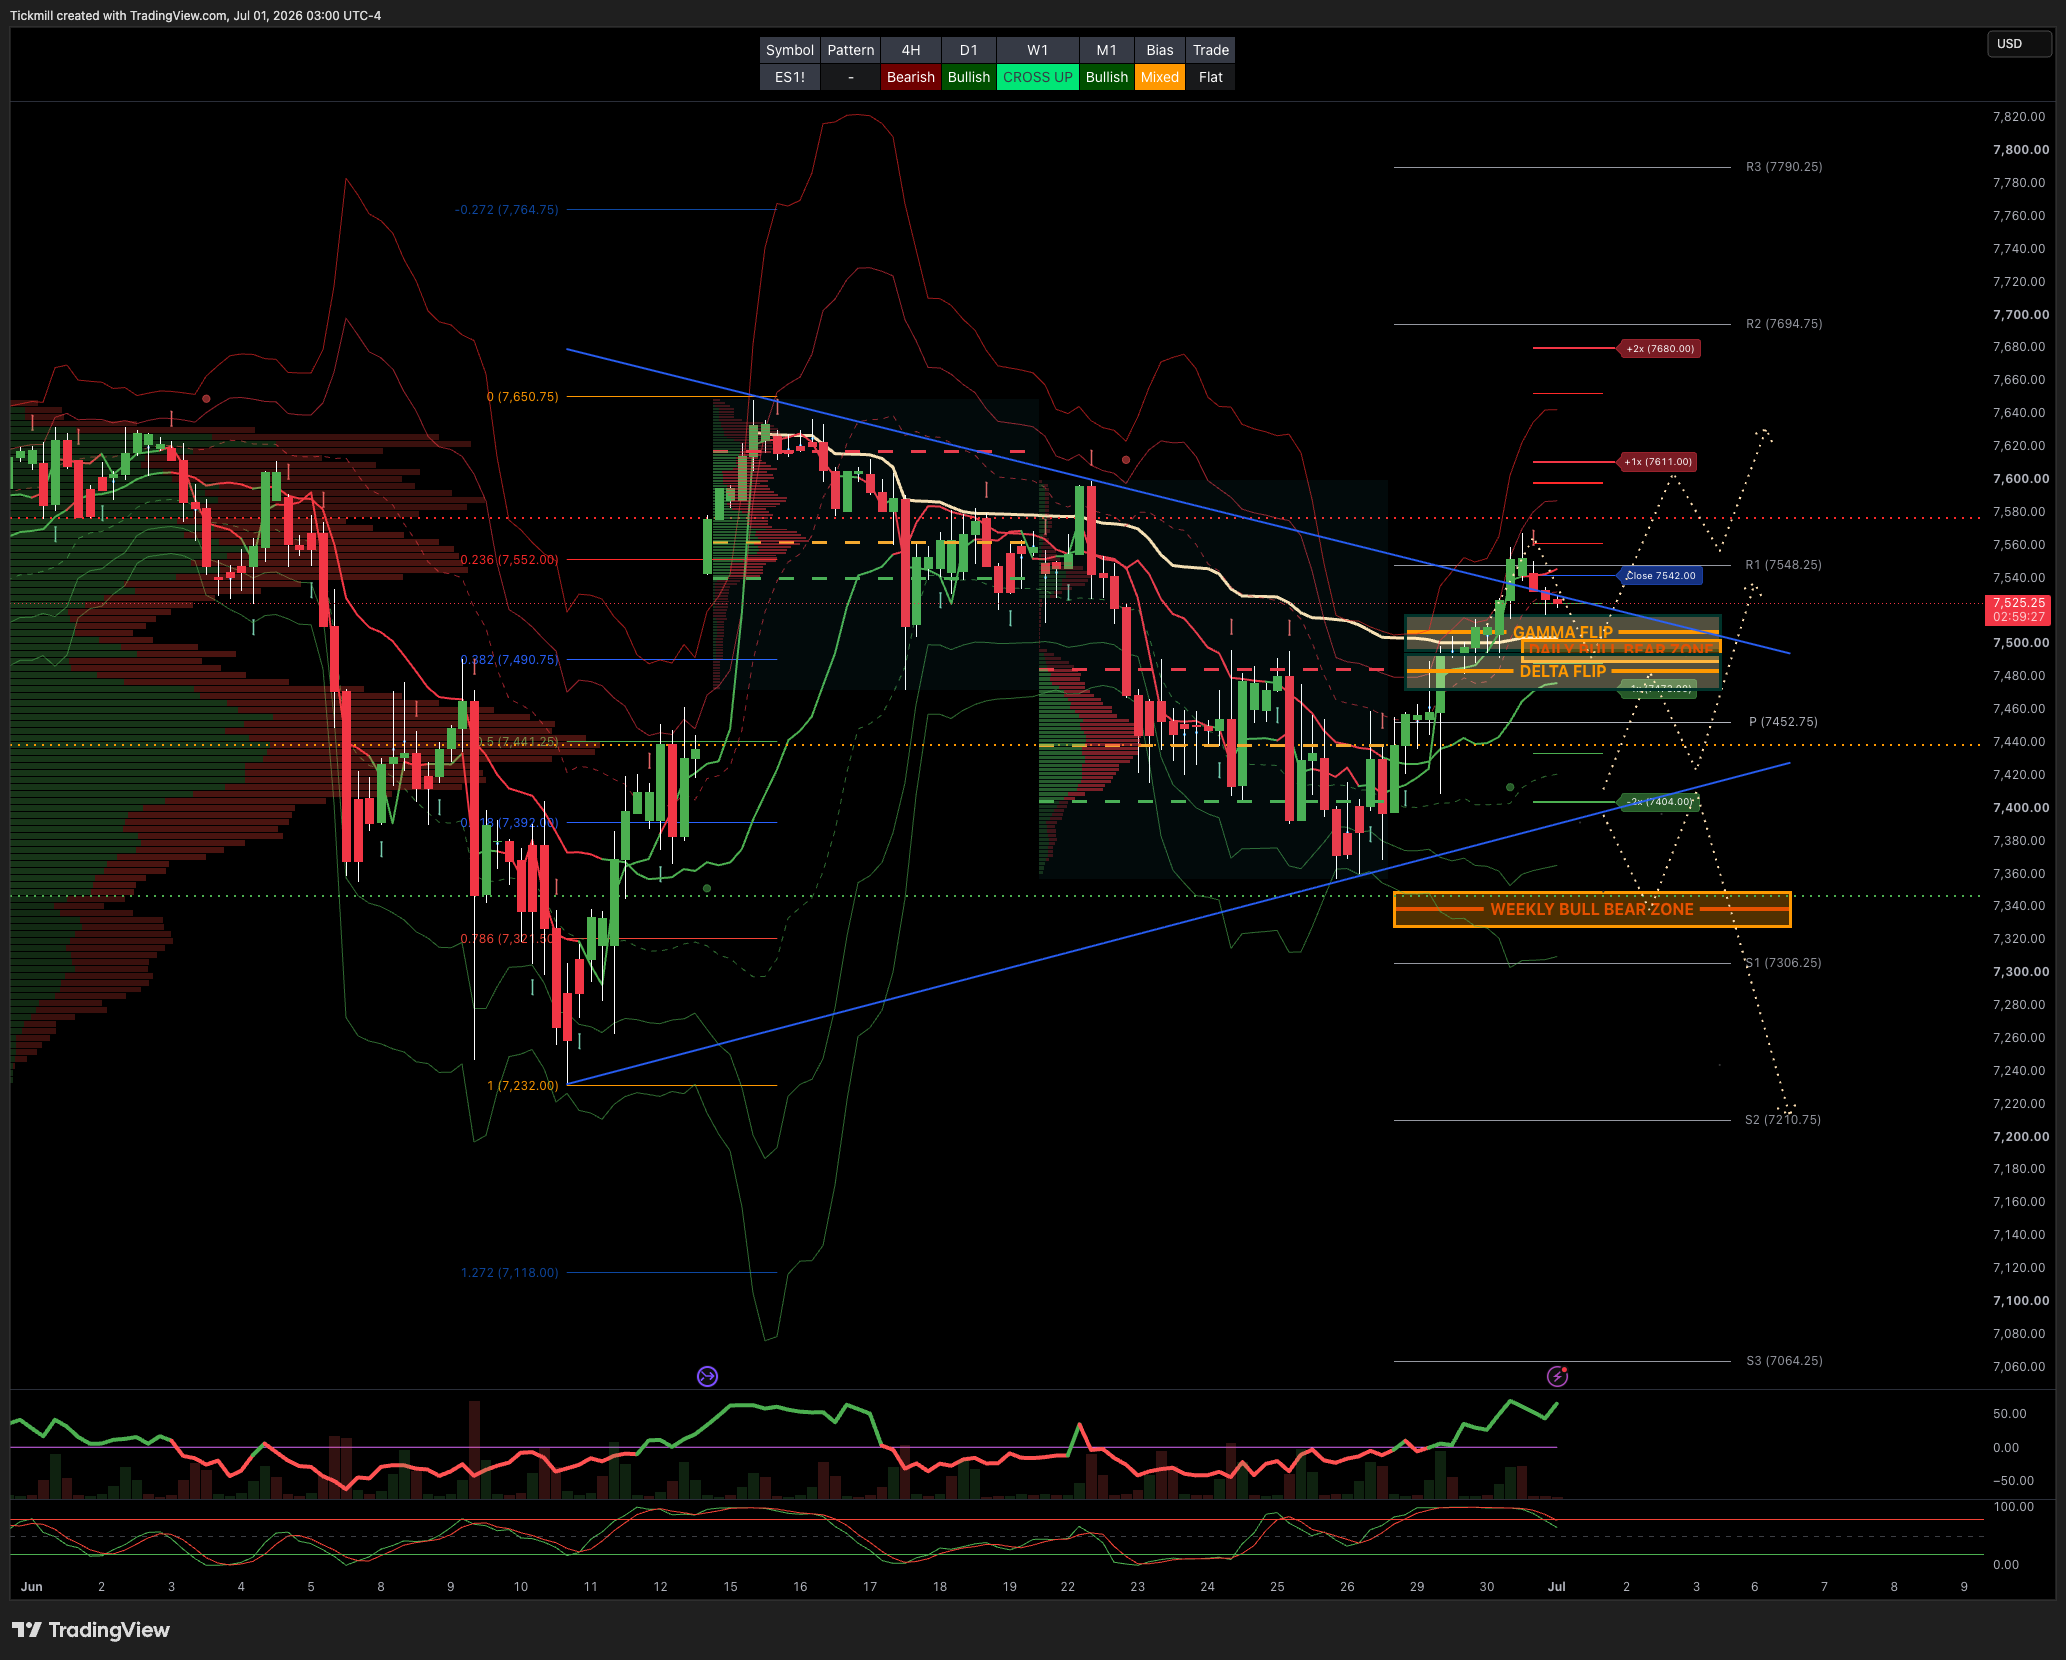
WEEKLY BULL BEAR ZONE 7350/40
WEEKLY RANGE RES 7280 SUP 7520
MONTHLY RANGE RES 7932 SUP 7384
JHEQX Q3 Collar Short Call Cap: ~7,750 – 7,900 - Long Put Strike: ~7,050 – 7,100 (approx. 5% downside protection) Short Put Strike: ~5,950
DEC2025 OPEX to DEC2026 OPEX is 945 points giving us a range of [5889,7779]
SPX PUT/CALL RATIO 1.10 (The numbers reflect options traded during the current session. A put-call ratio below 0.7 is generally considered bullish, and a put-call ratio above 1.0 is generally considered bearish.
DAILY VWAP BULLISH 7440
WEEKLY VWAP BULLISH 7494
MONTHLY VWAP BULLISH 7036
DAILY STRUCTURE - OTFH 7495
WEEKLY STRUCTURE - BALANCE 7648/7247
MONTHLY STRUCTURE - OTFH - 7199
Balance: This refers to a market condition where prices move within a defined range, reflecting uncertainty as participants await further market-generated information. Our approach to balance includes favouring fade trades at the range extremes (highs/lows) while preparing for potential breakout scenarios if the balance shifts.
One-Time Framing Higher (OTFH): This represents a market trend where each successive bar forms a higher low, signalling a strong and consistent upward movement.
One-Time Framing Lower (OTFL): This describes a market trend where each successive bar forms a lower high, indicating a pronounced and steady downward movement.
GAMMA FLIP 7507
DELTA FLIP 7483
DAILY RANGE RES 7611 SUP 7424
2 SIGMA RES 7680 SUP 7404
VIX BULL BEAR ZONE 17.4
TRADES & TARGETS
LONG ON REJECT/RECLAIM DAILY/MONTHLY BULL BEAR ZONE ***ACTIVE POSITION***
LONG ON REJECT/RECLAIM DAILY BULL BEAR ZONE TARGET DAILY RANGE RES
***ADDITIONAL SETUPS & TARGETS HIGHLIGHTED ON THE CHARTS***
(I FADE TESTS OF 2 SIGMA LEVELS ESPECIALLY INTO THE FINAL HOUR OF THE NY CASH SESSION AS 90% OF THE TIME WHEN TESTED THE MARKET WILL CLOSE ABOVE OR BELOW THESE LEVELS)
GOLDMAN SACHS FICC & EQUITIES TRADING DESK VIEWS
Yesterday’s tape was a classic quarter-end recovery session, helped by passive flows, July seasonality, and the market’s ability to hold the 50-day moving average in both SPX and NDX. The S&P gained 79bps to close at 7,498, NDX rose 168bps to 30,276, Russell added 55bps to 3,027, and the Dow finished 26bps higher at 52,317. The move came on broadly normal volumes, with 19.487bn shares traded versus a YTD daily average of 19.721bn, and a $1.3bn MOC to buy. The tone was firm but not euphoric, with the floor only a 3 out of 10 on activity, suggesting the strength was more flow- and technical-led than driven by a major discretionary risk reset.
The bounce was important because it followed last week’s test of the 50-day moving averages and effectively neutralized some of the near-term downside pressure created by the AI/Semi unwind. The timing also matters. We are moving into July, which has been an exceptionally strong seasonal window for NDX, up in 17 of the last 18 years. With the holiday week creating thinner liquidity and limited news flow, the market had room to reprice higher as vol compressed, passive quarter-end flows came through, and investors looked ahead to earnings rather than continuing to press last week’s de-risking.
Despite the volatility in June, the quarter was exceptionally strong. SPX and NDX both posted their best quarters since 2Q20, while NDX delivered its second-best quarter since 4Q01. The leadership was decisively semis-led, with SOX up 81% in 2Q26, its best quarterly return on record going back to 1994. That is the key context for the recent volatility. The AI/Semi drawdowns have been sharp, but they are occurring after one of the most powerful quarterly advances ever recorded in the group. Some of the late-June turbulence should therefore be viewed as digestion of an extraordinary move rather than a definitive change in trend.
The high-beta and momentum rebound was also notable. The GSPRHIMO high-beta momentum basket rose 330bps on the day and is now up more than 7% over the last two sessions, reversing Friday’s drawdown, which had been the largest single-day momentum pullback of the month. This suggests that the factor unwind did not become self-reinforcing. Instead, once quarter-end flows and technical support appeared, buyers quickly returned to the same high-beta expressions that had been sold. That is consistent with a market where investors are still willing to re-engage risk as long as liquidity and vol cooperate.
Industrials continue to be one of the more important broadening stories. The sector finished up 122bps and logged its third-best June in more than 20 years, gaining nearly 700bps. This fits with ISM holding above 50 for five consecutive months and a clearer bid from asset managers. Hedge fund net exposure remains too low, which creates scope for continued catch-up if macro data remain stable and earnings validate the industrial recovery. The industrial bid is important because it reduces the market’s dependence on megacap tech and supports the broader early-cycle growth argument.
Cross-asset signals were mostly supportive. VIX fell 6.91% to 16.42, crude slipped 93bps to $70.09, the 10-year rose modestly to 4.4415%, gold was essentially flat at 4,017, DXY firmed slightly to 101.20, and Bitcoin fell 247bps to 58,713. The combination of lower vol, stable oil, a contained rates move, and modest dollar strength is a constructive backdrop for equities. This was not a macro panic reversal; it was a technical and positioning recovery in a still-supportive macro environment.
Flows reinforced the technical nature of the move. The desk finished 430bps to buy versus a 30-day average of 20bps to buy, but activity was light. Both asset managers and hedge funds were slight net buyers, driven by demand in macro products and industrials. That indicates some re-risking, but not a wholesale chase. Given last week’s PB data showing the largest TMT net selling in more than a decade, yesterday’s modest buying suggests investors are beginning to add back exposure selectively, but the market is not yet back to full conviction mode ahead of earnings.
The derivatives tape was calm and consistent with a holiday-week grind higher. NDX fixed-strike vols were down in the front end despite big-tech outperformance, and RUT vols continued to come in after the Russell rebalance. This is exactly what should happen if the market is transitioning from event-driven hedging into post-rebalance vol compression. The desk noted a tilt toward buyers of short-dated topside S&P vol, which fits the idea that some investors are looking to participate in a July/quarter-end continuation while keeping risk defined.
At the same time, larger spot swings in tech mean optionality remains attractive. The desk likes owning short-dated QQQ optionality, which makes sense given that Tech is still producing outsized realized moves even as implied vols come in. In single names, Mag7 looks more interesting after trading well, and MSFT August 1x2 call spreads are highlighted as a way to get long with substantial payout potential while net selling volatility. That is consistent with the idea that hyperscalers may have de-rated quickly enough to start attracting value and structured upside demand, even though the AI capex debate is not resolved.
Nike’s after-hours reaction was weaker, with the stock down around 4% after a Q4 print that was better than feared on the headline but distorted by IEEPA tariff recovery. Underlying trends remain challenged, which was broadly expected, and most investors were short or underexposed into the quarter. The guidance call is the key swing factor. For the broader market, NKE is not systemically important, but it is relevant for the consumer read-through because recent consumer strength has looked more mechanical and rate/oil-driven than fundamentally sponsored.
The tactical setup now looks better than it did late last week, but not clean enough to abandon hedges. The S&P’s move back to 7,498 puts it above the short-term CTA pivot near 7,378, reducing near-term systematic selling risk and potentially flipping marginal CTA behavior less negative if the market can hold these levels. Vol compression, July seasonality, quarter-end flows, and improving breadth all support a constructive near-term tape. However, corporate buyback blackout remains a constraint, TMT positioning is still crowded despite recent de-risking, and earnings concentration remains extreme.
The next session’s implied straddle went out at 53bps. Using the S&P close of 7,498, that implies roughly 40 points of expected movement. That gives an approximate near-term range of 7,458 to 7,538. Holding above the lower end would support the view that quarter-end flows and July seasonality are stabilizing the tape, while a move through the upper end would point to renewed upside chase as investors rebuild exposure after last week’s TMT washout.
Disclaimer: The material provided is for information purposes only and should not be considered as investment advice. The views, information, or opinions expressed in the text belong solely to the author, and not to the author’s employer, organization, committee or other group or individual or company.
Past performance is not indicative of future results.
High Risk Warning: CFDs are complex instruments and come with a high risk of losing money rapidly due to leverage. 71% and 74% of retail investor accounts lose money when trading CFDs with Tickmill UK Ltd and Tickmill Europe Ltd respectively. You should consider whether you understand how CFDs work and whether you can afford to take the high risk of losing your money.
Futures and Options: Trading futures and options on margin carries a high degree of risk and may result in losses exceeding your initial investment. These products are not suitable for all investors. Ensure you fully understand the risks and take appropriate care to manage your risk.
Patrick has been involved in the financial markets for well over a decade as a self-educated professional trader and money manager. Flitting between the roles of market commentator, analyst and mentor, Patrick has improved the technical skills and psychological stance of literally hundreds of traders – coaching them to become savvy market operators!